Onion prices more than doubled in a year, a plate of food at a roadside eatery costs more than it did last Diwali, yet the rent on your flat barely moved. Which of these is inflation? All of them, in proportion. CPI inflation is the official measure that rolls thousands of such price changes into one number, and in September 2026 it was 5.54%, according to the latest release from the Ministry of Statistics and Programme Implementation (MoSPI).
That number decides a lot. It guides the Reserve Bank of India’s interest rate decisions, it shapes dearness allowance and wage talks, and it tells you whether your savings are growing in real terms or quietly shrinking. This guide explains how India measures consumer prices, what changed with the new 2024 base year, the difference between food and core inflation, RBI’s target, and how to work out the real return on your money.
What CPI inflation measures
MoSPI defines the Consumer Price Index (CPI) as a measure of changes over time in the general level of retail prices of selected goods and services that households buy for consumption. Think of it as the price of a very large shopping basket: rice, milk, vegetables, clothes, rent, electricity, bus fares, mobile plans, school fees, doctor visits and much more.
The index itself is just a number compared with a base. Inflation is the year-on-year percentage change in that number. MoSPI’s formula is simple: take this month’s index, subtract the index for the same month last year, divide by last year’s index and multiply by 100.
For example, the all-India combined CPI stood at 109.49 in September 2026 against 103.74 in September 2025. That works out to 5.54%. MoSPI publishes separate figures for rural, urban and combined India. In September 2026, rural inflation was 6.08% and urban inflation was 4.88%.
How MoSPI collects the prices
The prices come from the ground. Under the new series, MoSPI covers 1,465 rural markets and 1,395 urban markets across 434 towns, plus 12 online markets in cities with more than 25 lakh people. Field staff of the National Statistics Office collect prices on tablets instead of paper forms. Physical market prices are collected monthly and online prices weekly.
Some prices come from official records rather than shop visits. Rail fares come from the Ministry of Railways, fuel prices from the petroleum ministry’s planning cell, postal charges from the Department of Posts, and airfares and streaming subscriptions from online platforms. The result for each month is released on the 12th of the following month, or the next working day if the 12th is a holiday. The October 2026 figure is due on 12 November 2026.
Each new figure is provisional at first. MoSPI finalises it in the following month’s release. The August 2026 number, for instance, is now final at 4.83%. Small revisions like this are normal, so do not read too much into a change of one or two hundredths of a point.
The base year and the basket: what changed with CPI 2024
A base year is the reference point where the index equals 100. From the January 2026 data, MoSPI switched to a new series with base year 2024=100, replacing the older 2012 series. The basket and weights now come from the Household Consumption Expenditure Survey 2023-24, so they reflect how Indian families actually spend today.
- The number of weighted items rose from 299 to 358, with goods up from 259 to 308 and services up from 40 to 50.
- The index now follows the United Nations COICOP 2018 classification, with 12 divisions, so India’s CPI can be compared with other countries.
- Online prices and administrative data are now part of the index.
- A back series from January 2013 lets you compare the new numbers with earlier years.
The biggest shift is in food. Under the new structure, food and beverages carry a weight of 36.75% in the combined index, compared with about 42.62% under the old series. Families now spend a smaller share on food and more on transport, housing and services, and the index follows that change.
| Division (CPI 2024) | Weight, combined (%) | Inflation, September 2026 (%) |
|---|---|---|
| Food and beverages | 36.75 | 7.36 |
| Housing, water, electricity, gas and other fuels | 17.67 | 2.74 |
| Transport | 8.80 | 5.01 |
| Clothing and footwear | 6.38 | 3.93 |
| Health | 6.10 | 1.40 |
| Personal care, social protection and miscellaneous | 5.04 | 13.75 |
| Restaurants and accommodation services | 3.35 | 9.36 |
| Education services | 3.33 | 3.94 |
| All India (combined) | 100 | 5.54 |
Weights are from MoSPI’s CPI 2024 FAQs; inflation rates are provisional figures from the September 2026 release. Only the larger divisions are shown.
Food inflation and core inflation
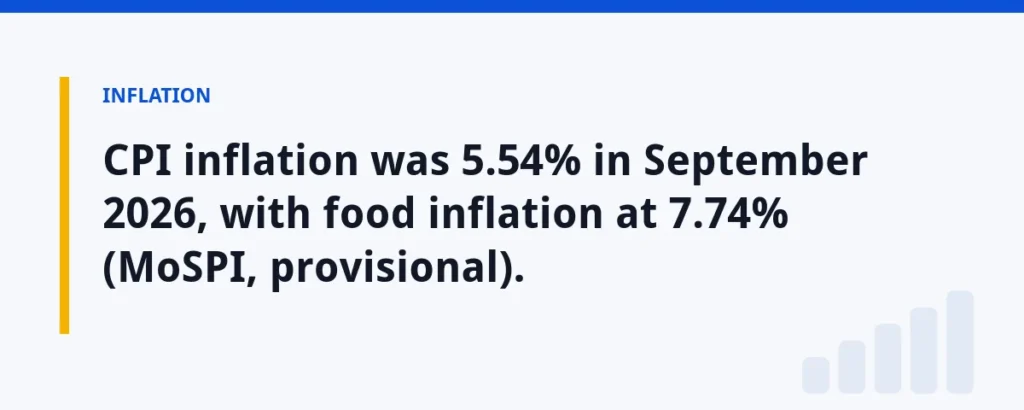
Food prices swing the most. A bad monsoon, a heatwave or a transport problem can send vegetable prices soaring within weeks, and a good harvest can crash them. MoSPI publishes a separate Consumer Food Price Index (CFPI) for this. In September 2026, food inflation was 7.74%, well above the headline figure. Onion prices were up about 108% from a year earlier, while potato and tomato prices were lower than a year ago.
Core inflation strips out the volatile parts, broadly food and fuel, to show the underlying trend in prices. It is not a separate MoSPI index, but RBI tracks it closely. In its October 2026 policy statement, RBI said core inflation rose to 4.2% in August, and to 2.9% if precious metals are also excluded. That last point matters in the new series: silver jewellery prices were up nearly 88% in September, pushing the “personal care and miscellaneous” division to 13.75%.
Why does the split matter? If headline CPI inflation is high because of a temporary spike in vegetables, RBI may wait it out. If core inflation is rising too, price pressures are spreading, and RBI is more likely to raise rates.
RBI’s inflation target
Under the RBI Act, the central government sets an inflation target in consultation with RBI. In its review of 25 March 2026, the government retained the target of 4% CPI inflation, with an upper tolerance limit of 6% and a lower limit of 2%, for April 2026 to March 2031. If average inflation stays above 6% or below 2% for three quarters in a row, RBI has to report to the government on why and what it will do about it.
The six-member Monetary Policy Committee uses the repo rate to steer inflation towards this target. After headline inflation climbed every month from 2.74% in January 2026 to 5.54% in September, the committee raised the repo rate to 5.50% on 7 October 2026, and projected CPI inflation at 5.2% for 2026-27.
| Month (2026) | Jan | Mar | May | Jul | Aug | Sep |
|---|---|---|---|---|---|---|
| CPI inflation, combined (%) | 2.74 | 3.40 | 3.93 | 4.45 | 4.83 | 5.54 |
Your real return: the number that matters
A fixed deposit that pays 7% does not make you 7% richer if prices rise 5.5% in the same year. Your real return is what is left after inflation. A quick estimate is the interest rate minus inflation. The exact formula is (1 + interest rate) divided by (1 + inflation), minus 1.
As an illustration, assume an FD rate of 7% a year and use September’s CPI inflation of 5.54%:
- Before tax, the real return is about 1.4% (1.07 ÷ 1.0554, minus 1).
- If you are in the 30% tax slab, the 7% becomes 4.9% after tax. Your real return is then about minus 0.6%. Your money grows in rupees but buys less.
Inflation also eats into money over long periods. As an illustration, if prices rise 6% a year, ₹1 lakh today will buy only what about ₹55,800 buys now after ten years. Put the other way, you would need around ₹1.79 lakh in ten years to buy what ₹1 lakh buys today. Our compound interest calculator shows how fast prices or savings compound over time.
Inflation is not all bad news for everyone. If you have a fixed-rate loan, or your income rises with prices, the real burden of each EMI shrinks over time. But for savers living on interest, such as retirees, a few years of high inflation can cut what their income buys by a large amount, which is why pension planning needs an inflation assumption built in.
Protecting your savings from inflation
You cannot control inflation, but you can plan for it.
- Check the real return, not the headline rate. Compare what an FD or small savings scheme pays, after tax, with recent CPI inflation. Our FD calculator helps with the first half of that sum.
- Keep only what you need in low-yield accounts. An emergency fund belongs somewhere safe and liquid. Long-term money left idle in a savings account loses value year after year.
- Match the asset to the goal. For goals 10 or more years away, many families use a mix that includes equity, which has historically had a better chance of beating inflation over long periods, though with ups and downs along the way.
- Use your own inflation rate for planning. School fees, medical costs and rent may rise faster or slower than the national average. Plan each goal with a realistic rate for that cost.
- Review once a year. When inflation rises, your monthly SIP or savings target may need a top-up to stay on track.
Why your own inflation may differ from the official number
The official CPI reflects an average household’s basket. Yours is different. A family that rents in a big city, pays private school fees and eats out often may feel prices rising faster than 5.54%. A rural household that grows some of its own food may feel food inflation less. The weights also show why: housing carries a weight of 25% in the urban index but about 11.8% in the rural index.
The state numbers vary too. In September 2026, combined CPI inflation ranged from under 3% in Mizoram to above 6.5% in Tamil Nadu, Odisha and Madhya Pradesh. MoSPI publishes state and item indices on its eSankhyiki portal if you want to see what is happening where you live.
Key takeaways
- CPI inflation is the year-on-year change in the price of a broad household basket. It was 5.54% in September 2026, with food inflation at 7.74%.
- Since January 2026, CPI uses base year 2024, a 358-item basket and weights from the 2023-24 household spending survey.
- RBI aims to keep CPI inflation at 4%, within a 2% to 6% band, until March 2031.
- Core inflation removes volatile items and shows whether price pressures are spreading.
- Always check your post-tax real return. A positive rupee return can still be a loss in real terms.