
What happened
Central Bank of India earned ₹1,469 crore in the quarter ended 30 September 2026, the second quarter of FY27. That is 21% more than the ₹1,324 crore the public sector lender made in the same quarter last year, according to its regulatory filing as covered by BusinessLine and The Hindu.
Total income rose to ₹11,737 crore from ₹10,212 crore. Interest income, the money earned on loans and investments, climbed to ₹10,357 crore from ₹8,743 crore.
Also read: ICICI Bank Q2 profit rises 20% to ₹14,843 crore; margin dips to 4.18% · Axis Bank Q2 profit rises 38% to ₹7,003 crore; NII up 12%
Net interest income (NII), which is interest earned minus interest paid to depositors and lenders, rose 26% to ₹4,146 crore from ₹3,283 crore. The Economic Times attributed the profit growth largely to strong loan growth, even as other income declined.
The cost-to-income ratio, which shows how much of income goes on running costs, improved to 58.95% from 62.42%. Operating profit, the profit before setting aside money for bad loans and taxes, edged up to ₹2,268 crore from ₹2,186 crore.
Asset quality and capital
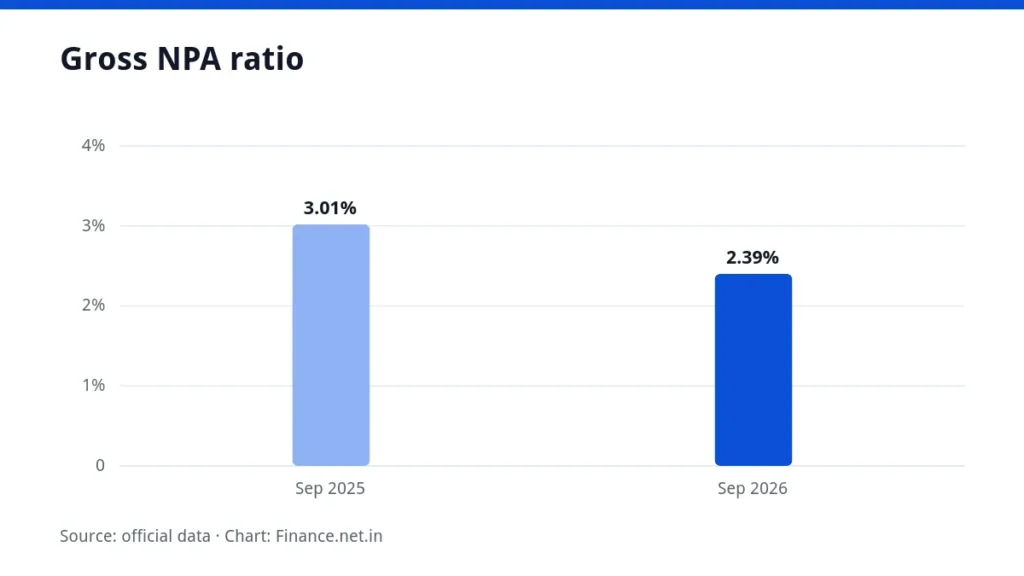
Gross non-performing assets (NPAs), meaning loans where borrowers have stopped paying, eased to 2.39% of gross advances at the end of September 2026. A year earlier the figure was 3.01%.
Net NPAs, which are gross NPAs after deducting the money the bank has set aside, fell to 0.31% from 0.48%.
Provisioning, the money a bank puts aside against possible loan losses, rose to ₹490 crore in the quarter from ₹144 crore a year ago. The Provision Coverage Ratio stood at 97.16%, up 28 basis points (0.28 percentage point) from 96.88%. You can read more about a basis point in our glossary.
The Capital to Risk-Weighted Assets Ratio (CRAR), a measure of the bank’s capital cushion relative to its risky assets, improved to 17.68% from 17.48%.
What it means for you
If you hold a deposit or account with the bank, the lower bad-loan ratios and higher capital ratio point to a stronger balance sheet than a year ago. The sources do not mention any change in deposit or loan rates.
If you are comparing deposit options, you can use our FD calculator to work out maturity amounts at any rate you are offered.
Background
Banks report results every quarter, and year-on-year comparisons, such as September 2026 against September 2025, are the usual way to read them. Net interest income is the core earnings measure for lenders, which is why reports described the growth as coming from core income.