What it is
EBITDA stands for Earnings Before Interest, Tax, Depreciation and Amortisation. It is a measure of how much a company earns from running its business, before the costs of its debt, its tax bill and the accounting charges for ageing assets are taken out.
Depreciation is the gradual write-down of physical assets such as factories and machinery. Amortisation is the same idea for intangible assets such as software or licences. Neither involves cash leaving the company in that quarter, which is why analysts often look at earnings before them.
EBITDA margin is EBITDA divided by revenue, shown as a percentage. It tells you how many paise of every rupee of sales are left after the day-to-day costs of operations.
How it works
A simple route to EBITDA is to start with net profit and add back interest, tax, depreciation and amortisation. Another is to start with revenue and subtract operating costs such as raw materials, wages and overheads.
Here is an illustrative example with made-up numbers. A company has revenue of ₹100 crore and operating costs of ₹85 crore. Its EBITDA is ₹15 crore and its EBITDA margin is 15%. If it then pays ₹3 crore in depreciation, ₹2 crore in interest and ₹3 crore in tax, net profit is ₹7 crore.
That gap is why the two figures can tell different stories. EBITDA compares the operating strength of companies with different debt levels, tax positions and asset bases. Net profit shows what is finally left for shareholders. EBITDA is not a profit figure under the accounting rules and it leaves out costs a company really has to bear, such as the cost of replacing machinery.
Many results reports carry both numbers, and a change in margin often says more than the rupee figure alone. You can pair this with the CAGR Calculator to see how a figure has grown over several years.
Why it is in the news
EBITDA is getting attention in the July-September (Q2 FY27) results season, because several companies have reported it alongside profit.
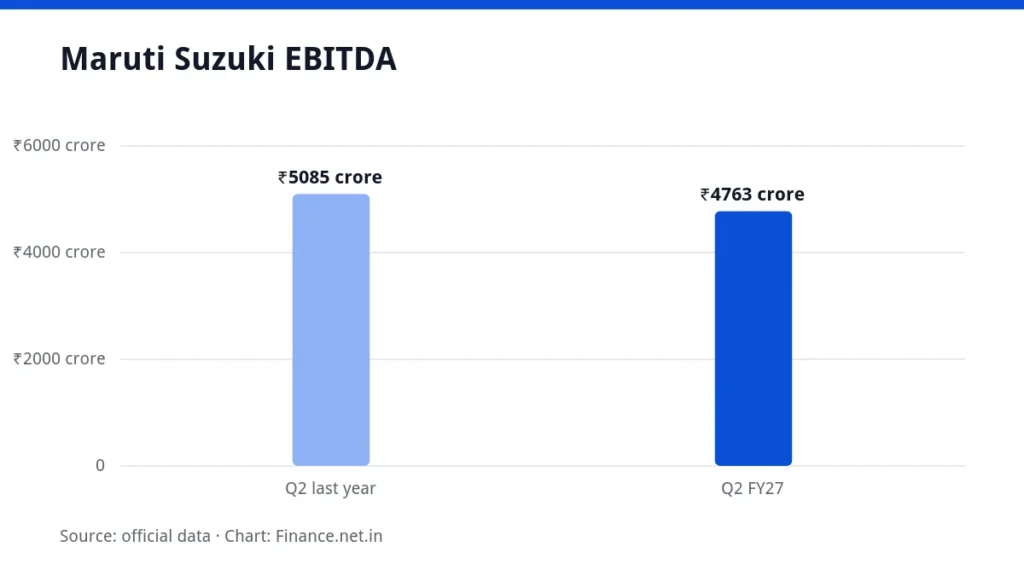
Maruti Suzuki India reported on 27 October 2026 that its EBITDA for the quarter was ₹4,763 crore, 6.3% lower than ₹5,085 crore a year earlier, according to CNBC-TV18. Its EBITDA margin narrowed to 9% from 12%. Over the same period revenue grew 26%, to about ₹53,340 crore. Our Maruti Suzuki Q2 coverage has the full results.
The example shows how margin can shrink even when sales jump. Raw material costs were 79.9% of net sales, against 75.7% a year earlier, CNBC-TV18 reported. In its investor presentation, the carmaker said the squeeze came from three things: costlier commodities tied to the conflict in West Asia, an unfavourable currency movement, and a smaller non-operating income after mark-to-market losses on its invested surplus. It said better realisation per vehicle, operating leverage and cost-cutting softened the blow.
At the other end, Economic Times reported that NTPC Green Energy’s EBITDA margins improved in the same quarter, as revenue rose 53.2% and net profit rose 56.2% to ₹137.5 crore. See our NTPC Green Energy coverage.
What it means for you
If you follow company results, EBITDA helps you separate the operating picture from items below the line. In Maruti’s case, other income fell to ₹429 crore from ₹966 crore and profit before tax declined to ₹3,166 crore from ₹4,291 crore, so the fall in profit was bigger than the fall in EBITDA.
A few points help when you read a results report:
- Check the margin as well as the amount, and compare it with the same quarter last year.
- Look at net profit and profit before tax too, since EBITDA leaves out interest, depreciation and tax.
- Note the reasons the company gives for margin changes, such as input costs or one-off items.
- Compare like with like. Companies in capital-heavy sectors carry large depreciation, so EBITDA can look much healthier than net profit.
None of this tells you whether any share is worth owning. It is a way to read the numbers more clearly.
Common questions
See the questions below for short answers on EBITDA versus profit and the margin.