What happened
State Bank of India (SBI), the country’s largest lender, reported a 14% rise in standalone net profit to ₹23,038 crore for the second quarter ended 30 September 2026. In the same quarter last year it earned ₹20,160 crore.
Net interest income (NII), the gap between what a bank earns on loans and pays on deposits, rose 15% year on year to ₹49,143 crore, according to the Economic Times.
According to a regulatory filing cited by PTI and reported by the Times of India, total income rose to ₹1,43,796 crore from ₹1,34,979 crore a year ago. Interest earned increased to ₹1,32,019 crore from ₹1,19,654 crore.
Asset quality
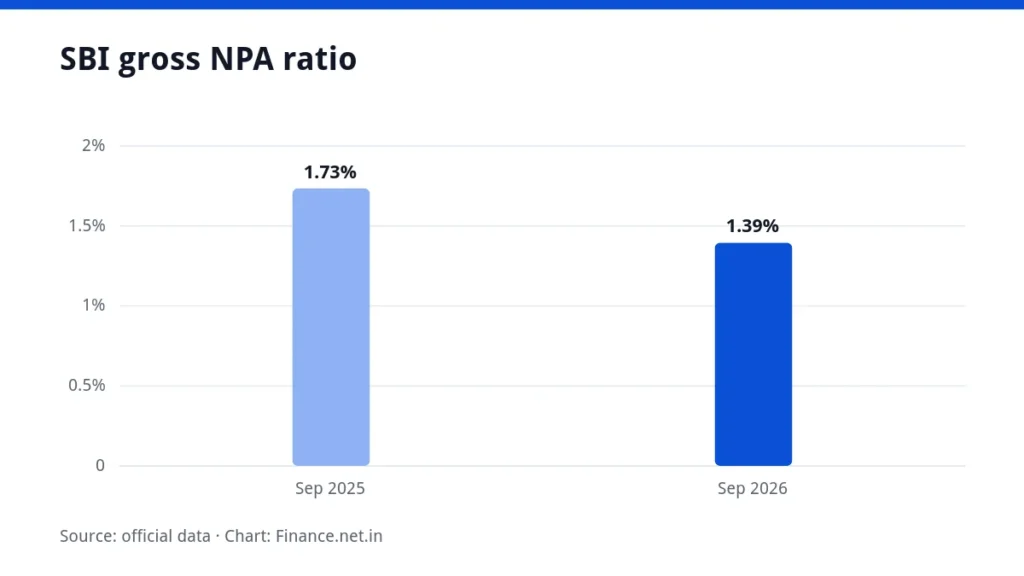
- Gross non-performing assets (NPAs, loans where repayments have stopped for a prolonged period) declined to 1.39% of gross advances, from 1.73% a year earlier.
- Net NPAs, which are gross NPAs after setting aside provisions, fell to 0.36% from 0.42%.
- Provisions for bad loans dropped to ₹2,759 crore from ₹4,132 crore in the year-ago quarter.
Group and capital position
On a consolidated basis, which includes SBI’s subsidiaries, net profit rose 20% to ₹25,361 crore from ₹21,137 crore. Consolidated total income was ₹1,87,756 crore, against ₹1,75,898 crore a year ago.
The capital adequacy ratio, a measure of how much capital a bank holds relative to its risk-weighted assets, improved to 16.09% as of 30 September 2026 from 14.62% a year earlier.
What it means for you
If you hold SBI shares directly or through a mutual fund, these figures are one input among many, and they do not on their own say anything about how the share price may move. For depositors, a lower level of bad loans and a higher capital ratio are generally read as signs of a bank with a stronger cushion against losses.
Borrowers will see no direct change from the results themselves. If you want to check how interest rates affect your own repayments, you can try the EMI Calculator.
Background
Quarterly results let investors compare a bank’s earnings and loan quality with the same period a year earlier. Other companies reporting this season are covered in our stocks in news roundup. Market indices such as the Sensex and Nifty 50 include SBI among their constituents.