
What happened
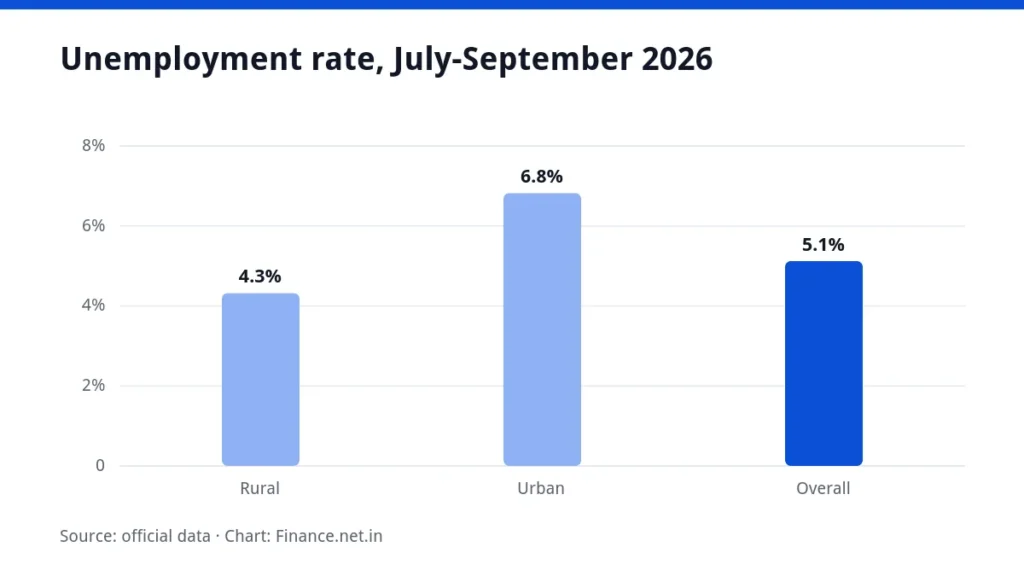
India’s unemployment rate came in at 5.1% for July-September 2026, down from 5.4% in the previous quarter. The figures were published on Tuesday, 10 November by the Ministry of Statistics and Programme Implementation (MoSPI) from its latest Periodic Labour Force Survey (PLFS) round, and they cover people aged 15 years and above.
The unemployment rate is the share of people in the labour force who are looking for work but do not have a job. The ministry said the overall rate had “improved” compared with the previous quarter.
Rural and urban split
The fall came mainly from rural areas, where unemployment dropped to 4.3% from 4.8% in April-June 2026. Urban unemployment rose slightly to 6.8% from 6.7%.
More people working or looking for work
The labour force participation rate, meaning the share of people aged 15 and above who are either employed or seeking work, rose to 55.5% from 54.6%. In rural areas it rose to 58.1% from 56.9%. In urban areas it slipped to 50.4% from 50.2%.
The share of people actually employed improved to 52.7% from 51.7%. Rural employment rose to 55.6% from 54.2%, while the urban figure stayed almost unchanged at 46.9%.
Women’s participation
The share of women who were working or looking for work increased to 34.7% from 33.2%. The share of women who were employed rose to 32.8% from 31.3%.
Type of work
In rural areas, the share of workers engaged in agriculture rose to 56.7% from 52.9%. The share of self-employed rural workers increased to 62.7% from 61.4%. In cities, the share of workers in regular salaried jobs edged up to 49.6% from 49.3%.
The ministry estimated that about 57.9 crore people aged 15 and above were employed on average during the quarter, of whom 40.5 crore were men and 17.4 crore were women.
What it means for you
A lower headline rate suggests fewer people who wanted work were without it in the quarter, especially in villages. In cities the picture was flatter, with a marginal rise in joblessness and a small dip in participation.
The jump in the share of rural workers in agriculture is worth reading alongside the fall in rural unemployment, since the data shows more rural work coming from farming and self-employment rather than salaried jobs. Household budgets, loan repayment plans and spending decisions depend on individual circumstances, so the national figures are a broad guide only. If you are planning a home loan, you can test affordability with our EMI calculator.
Background
The PLFS is the government’s survey for tracking employment and unemployment. This release sets July-September 2026 against the quarter before it, April-June 2026. Because the comparison is quarter on quarter, seasonal factors such as the farming cycle can influence the numbers, though the sources do not attribute the change to any single cause.