A friend tells you a company’s share “looks cheap” because its P/E ratio is 8, while another one at 40 “looks expensive”. Then you open the results and find fifty pages of tables with line items you have never heard of. Most people stop right there. But reading a company’s financials is a small set of skills, and you can learn the basics in an evening.
This guide walks through the balance sheet, the profit and loss statement, and four numbers worth calculating: the P/E ratio, the debt-to-equity ratio, return on equity, and a margin. It uses a made-up company so you can follow every rupee. It names no stock and gives no advice on buying or selling anything. It only explains what the numbers mean.
The three statements in one minute
Every listed company publishes three core statements, usually together with notes that explain them.
- Profit and loss statement: what the company earned and spent over a period (a quarter or a year). It shows whether the business made money.
- Balance sheet: a snapshot on one date of what the company owns (assets), what it owes (liabilities) and what is left for shareholders (equity).
- Cash flow statement: where cash actually came from and went. A company can show a profit and still run short of cash if customers pay late.
SEBI’s guide to the contents of an offer document lists the same building blocks: a statement of assets and liabilities, a statement of profit and loss, and accounting ratios such as earnings per share, return on net worth, net asset value per share, P/E and debt/equity. When a company comes to the market, these are the figures regulators want investors to see.
Meet an illustrative company
To keep things concrete, take an imaginary company, Sundar Tools Ltd, that makes machine parts. Everything below is invented for teaching. The figures are in ₹ crore.
| Profit and loss, year ended 31 March | ₹ crore |
|---|---|
| Revenue from operations | 800 |
| Operating costs (materials, wages, other) | 640 |
| Operating profit before depreciation (EBITDA) | 160 |
| Depreciation | 40 |
| Operating profit after depreciation (EBIT) | 120 |
| Interest paid | 20 |
| Profit before tax | 100 |
| Tax | 25 |
| Profit after tax | 75 |
Read it top to bottom. Sales of ₹800 crore leave ₹160 crore after the day-to-day costs. Machines wear out, so ₹40 crore is charged as depreciation. The company has borrowed money, so ₹20 crore goes to lenders as interest. The tax office takes ₹25 crore. What remains, ₹75 crore, belongs to the shareholders. That last line is also called net profit.
Reading the balance sheet
A balance sheet always balances, because what the company owns is paid for either by its owners or by lenders and suppliers. Here is Sundar Tools on 31 March.
| Assets | ₹ crore | Liabilities and equity | ₹ crore |
|---|---|---|---|
| Factory, machines, land | 450 | Share capital and reserves (equity) | 500 |
| Inventory | 120 | Borrowings | 200 |
| Money owed by customers | 130 | Money owed to suppliers and others | 150 |
| Cash and bank | 100 | ||
| Other assets | 50 | ||
| Total | 850 | Total | 850 |
Three things to look at. First, how much of the company is funded by borrowing (₹200 crore of ₹850 crore) versus shareholders’ money (₹500 crore). Second, whether customers are paying on time: ₹130 crore owed against yearly sales of ₹800 crore is about 59 days of sales, which is reasonable for a manufacturer. Third, whether cash and near-cash assets cover short-term obligations.
The balance sheet shows one date, so compare it with last year’s. A balance sheet that gets weaker each year, with rising borrowings and rising unpaid customer bills, tells a story even when profit is steady.
The P/E ratio
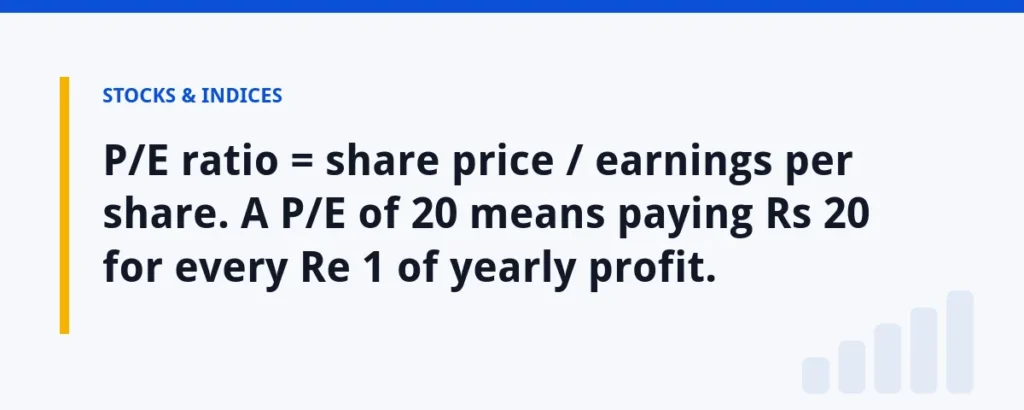
The P/E ratio, or price-to-earnings ratio, compares the share price with the profit earned per share. First calculate earnings per share (EPS): profit after tax divided by the number of shares. Say Sundar Tools has 10 crore shares. Then EPS is ₹75 crore divided by 10 crore, which is ₹7.50.
Now assume, as an illustration only, that the share trades at ₹150. The P/E ratio is ₹150 divided by ₹7.50, which is 20. In plain words, the market is paying ₹20 for each ₹1 of yearly profit, and at today’s profit it would take 20 years of earnings to equal the price.
A high P/E ratio can mean investors expect profits to grow fast, or it can mean the price has run ahead of reality. A low one can mean the business is out of favour, cyclical or troubled, or simply cheap. The number alone does not tell you which. Three cautions apply.
- Compare companies in the same business. A P/E ratio of 20 is ordinary in one industry and extreme in another. SEBI’s offer document guide itself asks for the P/E to be shown against the industry P/E where available.
- Check whether the profit is normal. A one-time gain from selling land can inflate EPS and make the P/E look low.
- Know whether it uses the last four quarters (trailing) or an estimate of the future (forward). Websites quote different ones.
Debt-to-equity ratio
The debt-to-equity ratio shows how much a company has borrowed for every rupee of shareholders’ money. For Sundar Tools, borrowings of ₹200 crore divided by equity of ₹500 crore gives 0.4. That means ₹0.40 of debt for each ₹1 of equity.
Lower is usually safer, because interest has to be paid even in a bad year. But the right level depends on the business. A company with steady cash flows can carry more debt than one whose sales swing wildly. Look also at interest cover: EBIT divided by interest. Here ₹120 crore divided by ₹20 crore is 6 times, so profit covers interest six times over. A figure close to 1 would mean almost all operating profit goes to lenders.
SEBI’s guide also asks for debt/equity ratios before and after an issue of shares to be shown in the offer document, which tells you how important regulators consider this figure.
Return on equity
Return on equity (ROE) measures how much profit a company earns on the money shareholders have put in. Divide profit after tax by shareholders’ equity: ₹75 crore divided by ₹500 crore is 15%. In other words, each ₹100 of shareholders’ funds earned ₹15 this year.
ROE is more useful across several years than in one. A company that earns 15% year after year is doing something right. A company with a high ROE this year may have a small equity base because of past losses, or may have borrowed heavily, which also lifts ROE. That is why ROE and debt-to-equity should be read together. Some analysts use average equity over the year, which gives a slightly different figure. SEBI’s guide uses the term return on net worth for the same idea, and says it should be calculated without counting revaluation reserves.
Margins and other quick checks
Margins show how much of each rupee of sales turns into profit. For Sundar Tools, EBITDA margin is ₹160 crore divided by ₹800 crore, which is 20%. Net profit margin is ₹75 crore divided by ₹800 crore, about 9.4%. Track both across several years. Falling margins with rising sales can mean the company is cutting prices or costs are rising faster than revenue.
Two more checks take a minute. The current ratio compares short-term assets with short-term obligations. If we treat inventory, customer dues and cash (₹350 crore) as current assets, and suppliers’ dues plus ₹50 crore of short-term borrowing (₹200 crore) as current liabilities, the ratio is 1.75. Anything well below 1 deserves a question. The price-to-book ratio divides the share price by net worth per share: equity of ₹500 crore over 10 crore shares is ₹50 a share, so at ₹150 the price is 3 times book value.
| Ratio | How to calculate | Sundar Tools (illustration) |
|---|---|---|
| EPS | Profit after tax / number of shares | ₹7.50 |
| P/E ratio | Share price / EPS | 20 |
| Debt-to-equity | Borrowings / equity | 0.4 |
| Return on equity | Profit after tax / equity | 15% |
| Interest cover | EBIT / interest | 6 times |
| Net margin | Profit after tax / revenue | 9.4% |
Where to find the real numbers
Listed companies file results with the stock exchanges. SEBI’s FAQs on its listing rules say that a listed company must submit audited annual results within 60 days from the end of the financial year, and that the last quarter’s results must be audited or limited reviewed. Quarterly results are due within 45 days of the quarter end, and annual audited results within 60 days of the year end. You can read them on the company’s own website under investor relations, and on the websites of the exchanges.
Open the annual report rather than a summary website when you can. The notes to the accounts tell you about borrowings, related-party dealings and one-time items, and the auditor’s report tells you whether the accounts were qualified. Companies with subsidiaries publish both standalone and consolidated results. Consolidated numbers give the whole group, and they are usually the ones to use.
Traps that fool new readers
A few habits keep beginners from misreading results. Do not judge a company on one quarter, because sales for many businesses rise and fall with the season. Compare a quarter with the same quarter a year ago.
Watch for profit that does not turn into cash. If Sundar Tools showed ₹75 crore profit but its cash flow statement showed only ₹10 crore from operations for three years in a row, something is off, perhaps customers are paying slowly or stock is piling up. Look at the notes for items called exceptional or one-time, since they can lift or cut profit for a single year.
Finally, remember that ratios describe the past. A low P/E ratio does not make a company safe, and a high ROE does not make it a good business next year. Ratios help you ask better questions. They do not answer them.
A five-step routine and key takeaways
- Check revenue and profit for at least five years, not one quarter.
- Look at margins for the same period. Are they stable, rising or falling?
- Read the balance sheet for borrowings, customer dues and cash.
- Calculate P/E, debt-to-equity and ROE, and compare only with similar businesses.
- Read the auditor’s report and the notes for anything unusual.
- The profit and loss statement shows performance, the balance sheet shows strength, and the cash flow statement shows real cash.
- The P/E ratio is price divided by earnings per share. By itself it is neither good nor bad.
- Debt-to-equity and interest cover show how much risk comes from borrowing.
- ROE shows how well shareholders’ money is used, and is best read over several years.
This guide is for education. It does not recommend buying, selling or holding any security, and the company above is imaginary.